52659 ZIP Code, Winfield, IA
Henry County · Louisa County · 67.1 sq mi of land · 273 data points on this page
Where is 52659?
52659 is a ZIP code in Winfield, Iowa — mostly in Henry County (71% of its land), with smaller parts in Louisa County. It covers 67 square miles of land. The closest ZIP codes are 52647, 52644 and 52652. 1,329 people live here in 589 households. It is rural, with fewer than 100 people per square mile, and most homes are owner-occupied (76%). Median household income is $55,125, below the Iowa median of $75,059; the median age is 45.2, older than most ZIP codes.
- Mailing city
- Winfield, IA
- County
- Henry County
- Land area
- 67 sq mi
- Population
- 1,329
- Median household income
- $55,125
- Carrier routes
- 2 (546 homes)
Overview
Carrier routes in 52659
Every USPS carrier route in 52659 with current mailbox counts and an estimated household profile for each. EDDM mails by the route, so this is the level you choose at. How carrier routes work
- 2 rural routes (R)546 homes · a rural carrier, usually curbside boxes along roads
Smallest route R302 has 261 homes, the median route 273, and the largest, R301, 285. USPS counts 546 home mailboxes today; the Census counted 589 occupied households here (2020–2024 average). The gap is new construction, vacant homes and boundary differences.
Full Service 6.5×9 postcard to every home in 52659 (546 homes): $645.07 ($1.18 each, printing, mailing service and postage) · no sales tax outside TexasMail it yourself: print-only 6.5 × 9 postcards · See all EDDM prices · Other EDDM sizes
Homes per route
How many of 52659's 2 routes fall in each size band
Route and mailbox counts: USPS EDDM route data.
Best routes in 52659 for…
Most businesses
For B2B offers: office supplies, cleaning, IT, catering and commercial services.
| Route | Businesses | Homes |
|---|---|---|
| R302 | 4 | 261 |
| R301 | 1 | 285 |
Income, families, owners, movers and home age are estimates for each route; routes with fewer than 100 homes are left out of those lists. How we estimate route figures · How to select EDDM carrier routes
Every route: map and table
Shows routes at or above this ZIP's middle route for that measure, and selects them.
| Select | Open in route map | |||||||
|---|---|---|---|---|---|---|---|---|
| R301 — show route profile | 285 | 1 | $77,539 | — | — | — | Map | |
| R302 — show route profile | 261 | 4 | $77,539 | — | — | — | Map |
Full Service 6.5×9 postcard to every home in 52659 (546 homes): $645.07 ($1.18 each, printing, mailing service and postage) · no sales tax outside Texas
Route-level demographics (income, owners, kids, movers) are being rolled out ZIP by ZIP; mailbox counts are current USPS figures.
EDDM mailing in ZIP code 52659
Planning a mailing in Winfield, IA? 52659 has 2 carrier routes and 546 home mailboxes. Compare routes by homes, estimated income, homeowners and families above, pick the ones that fit, and see the printing and mailing price before you order.
People
Who lives in 52659: age, household makeup and background.
Population pyramid
Share of all residents by age and sex · hover a bar for the comparison area
| Age | Men | Women |
|---|---|---|
| <5 | 47 | 51 |
| 5–9 | 29 | 43 |
| 10–14 | 37 | 67 |
| 15–19 | 23 | 24 |
| 20–24 | 25 | 16 |
| 25–29 | 39 | 38 |
| 30–34 | 12 | 35 |
| 35–39 | 65 | 36 |
| 40–44 | 22 | 52 |
| 45–49 | 25 | 9 |
| 50–54 | 28 | 19 |
| 55–59 | 43 | 44 |
| 60–64 | 66 | 47 |
| 65–69 | 86 | 68 |
| 70–74 | 45 | 48 |
| 75–79 | 31 | 15 |
| 80–84 | 5 | 29 |
| 85+ | 16 | 44 |
Age
% of all residents · largest group: 65–74 (18.6%)
| Age | ZIP 52659 | Iowa | U.S. |
|---|---|---|---|
| <10 | 12.8% | 12.2% | 11.6% |
| 10–19 | 11.3% | 13.7% | 13.0% |
| 20–24 | 3.1% | 7.1% | 6.5% |
| 25–34 | 9.3% | 12.4% | 13.7% |
| 35–44 | 13.2% | 12.6% | 13.2% |
| 45–54 | 6.1% | 11.3% | 12.2% |
| 55–64 | 15.0% | 12.6% | 12.7% |
| 65–74 | 18.6% | 10.6% | 10.2% |
| 75+ | 10.5% | 7.6% | 7.1% |
Household type
% of households · largest group: Married couple (47.0%)
| Household type | ZIP 52659 | Iowa | U.S. |
|---|---|---|---|
| Married couple | 47.0% | 48.3% | 46.9% |
| Unmarried couple | 2.5% | 7.6% | 7.2% |
| Woman, no partner | 24.1% | 24.7% | 27.5% |
| Man, no partner | 26.3% | 19.4% | 18.4% |
Race & ethnicity
% of all residents · largest group: White (92.6%)
| Race & ethnicity | ZIP 52659 | Iowa | U.S. |
|---|---|---|---|
| Hispanic or Latino | 6.1% | 7.3% | 20.1% |
| White | 92.6% | 82.3% | 56.9% |
| Black | 0.0% | 3.8% | 11.8% |
| Asian | 0.1% | 2.5% | 5.8% |
| Multiracial | 1.0% | 3.5% | 4.2% |
| Other | 0.3% | 0.6% | 1.2% |
Households at a glance
Tick = IowaTick = U.S.
How it has changed
Three non-overlapping ACS 5-year periods (dollars as published, not inflation-adjusted; boundaries changed in 2020)
Income & spending power
Household income, benefits and economic security.
Household income
% of households · largest group: $50–75K (17.7%)
| Household income | ZIP 52659 | Iowa | U.S. |
|---|---|---|---|
| <$10K | 2.2% | 4.0% | 5.1% |
| $10–15K | 5.8% | 3.2% | 3.5% |
| $15–25K | 15.3% | 6.7% | 6.4% |
| $25–35K | 6.8% | 7.2% | 6.7% |
| $35–50K | 14.1% | 11.3% | 10.1% |
| $50–75K | 17.7% | 17.5% | 15.5% |
| $75–100K | 14.6% | 14.0% | 12.6% |
| $100–150K | 13.1% | 18.7% | 17.4% |
| $150–200K | 6.8% | 8.8% | 9.5% |
| $200K+ | 3.7% | 8.6% | 13.2% |
Income facts
Tick = IowaTick = U.S.
Housing
Who owns, what they live in, and what it costs.
Tenure
% of housing units · largest group: Owned outright (40.3%)
| Tenure | ZIP 52659 | Iowa | U.S. |
|---|---|---|---|
| Owned, with mortgage | 31.6% | 39.6% | 35.9% |
| Owned outright | 40.3% | 26.4% | 22.9% |
| Rented | 22.1% | 25.6% | 31.0% |
| Vacant | 6.0% | 8.4% | 10.2% |
Type of building
% of housing units · largest group: Detached house (77.7%)
| Type of building | ZIP 52659 | Iowa | U.S. |
|---|---|---|---|
| Detached house | 77.7% | 72.2% | 61.3% |
| Townhome | 0.0% | 4.5% | 6.3% |
| 2–4 units | 2.9% | 5.6% | 7.7% |
| 5–19 units | 6.5% | 7.5% | 8.8% |
| 20+ units | 3.8% | 6.9% | 10.3% |
| Mobile / other | 9.1% | 3.2% | 5.7% |
Home value
% of owner-occupied homes · largest group: $100–150K (24.7%)
| Home value | ZIP 52659 | Iowa | U.S. |
|---|---|---|---|
| <$50K | 18.7% | 6.6% | 5.3% |
| $50–100K | 24.5% | 11.2% | 6.3% |
| $100–150K | 24.7% | 13.8% | 7.0% |
| $150–200K | 12.0% | 16.2% | 9.1% |
| $200–300K | 8.9% | 23.0% | 17.8% |
| $300–500K | 5.8% | 21.3% | 26.7% |
| $500K–1M | 2.4% | 6.8% | 20.7% |
| $1M+ | 2.9% | 1.1% | 7.0% |
Year built
% of housing units · largest group: Pre-1960 (58.2%)
| Year built | ZIP 52659 | Iowa | U.S. |
|---|---|---|---|
| 2020+ | 0.0% | 1.7% | 2.0% |
| 2010s | 2.6% | 9.2% | 9.4% |
| 2000s | 3.2% | 10.8% | 13.6% |
| 1990s | 3.3% | 9.6% | 12.4% |
| 1980s | 11.2% | 7.1% | 12.9% |
| 1970s | 13.9% | 14.0% | 14.2% |
| 1960s | 7.7% | 9.7% | 9.9% |
| Pre-1960 | 58.2% | 37.9% | 25.5% |
Monthly rent
% of renters paying cash rent · largest group: $500–999 (61.1%)
| Monthly rent | ZIP 52659 | Iowa | U.S. |
|---|---|---|---|
| <$500 | 13.0% | 8.6% | 6.7% |
| $500–999 | 61.1% | 45.3% | 21.0% |
| $1,000–1,499 | 26.0% | 31.9% | 27.9% |
| $1,500–1,999 | 0.0% | 9.5% | 20.7% |
| $2,000–2,499 | 0.0% | 2.6% | 11.7% |
| $2,500–2,999 | 0.0% | 0.6% | 5.4% |
| $3,000+ | 0.0% | 1.4% | 6.6% |
Rent by bedrooms
Median gross rent · tick = Iowatick = U.S.
Why homes sit vacant
% of vacant homes · largest group: Other (76.3%)
| Why homes sit vacant | ZIP 52659 | Iowa | U.S. |
|---|---|---|---|
| For rent | 23.7% | 18.7% | 17.9% |
| Rented, not moved in | 0.0% | 4.4% | 3.5% |
| For sale | 0.0% | 6.3% | 5.4% |
| Sold, not moved in | 0.0% | 4.2% | 4.0% |
| Seasonal | 0.0% | 19.1% | 32.3% |
| Migrant worker | 0.0% | 0.2% | 0.2% |
| Other | 76.3% | 47.1% | 36.6% |
Movers
New residents are prime prospects for local services
2020 Census count: 1,499 residents, 654 housing units.
Work & commute
How residents earn a living and get to work.
Getting to work
% of workers 16+ · largest group: Drive alone (83.7%)
| Getting to work | ZIP 52659 | Iowa | U.S. |
|---|---|---|---|
| Drive alone | 83.7% | 76.1% | 69.4% |
| Carpool | 3.1% | 7.8% | 8.7% |
| Work from home | 8.7% | 11.1% | 14.5% |
| Transit | 0.0% | 0.7% | 3.2% |
| Walk | 3.8% | 2.9% | 2.3% |
| Other | 0.7% | 1.4% | 2.0% |
One-way commute
% of workers who commute · largest group: 20–29 (26.0%)
| One-way commute | ZIP 52659 | Iowa | U.S. |
|---|---|---|---|
| <10 min | 22.0% | 24.0% | 12.7% |
| 10–19 | 14.5% | 34.3% | 28.5% |
| 20–29 | 26.0% | 20.2% | 21.2% |
| 30–44 | 18.5% | 13.2% | 20.9% |
| 45–59 | 15.5% | 4.1% | 8.0% |
| 60+ min | 3.6% | 4.2% | 8.7% |
Where residents work (industry)
% of employed residents 16+ · largest group: Education & health (18.7%)
| Where residents work (industry) | ZIP 52659 | Iowa | U.S. |
|---|---|---|---|
| Education & health | 18.7% | 24.1% | 23.5% |
| Professional services | 7.6% | 7.5% | 12.2% |
| Retail | 13.8% | 11.5% | 10.9% |
| Finance & real estate | 3.3% | 7.5% | 6.5% |
| Manufacturing | 17.6% | 14.9% | 9.9% |
| Construction | 1.8% | 7.0% | 7.0% |
| Transport & utilities | 4.9% | 5.2% | 6.0% |
| Hospitality & arts | 2.9% | 6.9% | 8.7% |
| Government | 4.3% | 3.5% | 4.8% |
| Wholesale | 3.6% | 2.4% | 2.2% |
| Information | 2.9% | 1.4% | 1.8% |
| Agriculture & mining | 11.4% | 3.8% | 1.7% |
| Other services | 7.2% | 4.4% | 4.7% |
Occupation
% of employed residents 16+ · largest group: Sales & office (26.3%)
| Occupation | ZIP 52659 | Iowa | U.S. |
|---|---|---|---|
| Management & professional | 22.6% | 39.0% | 41.6% |
| Sales & office | 26.3% | 19.0% | 19.8% |
| Service | 13.9% | 15.2% | 16.7% |
| Production & transport | 21.4% | 17.2% | 13.2% |
| Construction & maintenance | 15.8% | 9.6% | 8.7% |
Jobs
Tick = IowaTick = U.S.
Employer type
% of employed residents 16+ · largest group: Private company (78.6%)
| Employer type | ZIP 52659 | Iowa | U.S. |
|---|---|---|---|
| Private company | 78.6% | 78.9% | 79.0% |
| Government | 9.1% | 14.4% | 14.8% |
| Self-employed | 11.6% | 6.5% | 6.1% |
| Unpaid family | 0.7% | 0.2% | 0.2% |
Education, language & internet
Schooling, languages spoken at home and how connected households are.
Education (age 25+)
% of adults 25 and over · largest group: High school (33.5%)
| Education (age 25+) | ZIP 52659 | Iowa | U.S. |
|---|---|---|---|
| No diploma | 5.8% | 6.8% | 10.6% |
| High school | 33.5% | 29.7% | 26.1% |
| Some college | 31.4% | 19.6% | 19.1% |
| Associate | 6.0% | 12.1% | 8.8% |
| Bachelor's | 17.6% | 21.2% | 21.4% |
| Graduate | 5.7% | 10.8% | 13.9% |
Students by level
% of residents 3+ enrolled in school · largest group: Grades 1–8 (57.3%)
| Students by level | ZIP 52659 | Iowa | U.S. |
|---|---|---|---|
| Preschool | 15.9% | 6.5% | 5.8% |
| Kindergarten | 2.4% | 5.5% | 5.1% |
| Grades 1–8 | 57.3% | 43.4% | 41.5% |
| Grades 9–12 | 16.3% | 22.6% | 22.2% |
| College / grad | 8.1% | 21.9% | 25.3% |
Language & connectivity
Tick = IowaTick = U.S.
Local businesses
Every establishment with employees that the Census Bureau counted in 52659 (ZIP Codes Business Patterns 2023).
Top industries
Establishments by sector · index = how common vs. the U.S. per resident (1.0× = same)
- Other Services (except Public Administration)82.5×
- Finance and Insurance42.2×
- Retail Trade30.7×
- Professional, Scientific, and Technical Services30.8×
- Health Care and Social Assistance30.8×
| Industry | Businesses | vs U.S. |
|---|---|---|
| Other Services (except Public Administration) | 8 | 2.5× |
| Finance and Insurance | 4 | 2.2× |
| Retail Trade | 3 | 0.7× |
| Professional, Scientific, and Technical Services | 3 | 0.8× |
| Health Care and Social Assistance | 3 | 0.8× |
Businesses that mail to neighbors
Counts of industries that use EDDM most · vs U.S. per resident
Business size
Establishments by number of employees
Most common business types
Detailed industries (NAICS 4-digit)
Counts cover establishments with paid employees; the Census Bureau withholds some size details to protect confidentiality.
Nearby ZIP codes
Closest ZIP codes by distance between Census center points.
Areas that include 52659
Where 52659 ranks
- No. 5 of 5: highest median household income in Henry County
- No. 5 of 5: highest median home value in Henry County
- No. 4 of 5: highest share of owner-occupied homes in Henry County
- No. 5 of 5: highest share of households with children in Henry County
- No. 2 of 5: highest share of residents who moved in during the past year in Henry County
- No. 5 of 5: lowest median age in Henry County
- No. 1 of 5: highest median age in Henry County
- No. 5 of 5: fastest population growth in Henry County
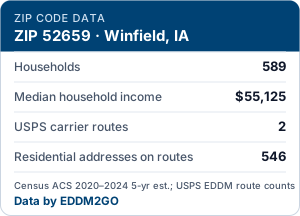
Get the free 52659 data badge
Realtors, chambers and local businesses can show 52659's key figures on their own site. The badge is free, has no tracking, cookies or scripts, and links back to this page. Figures are Census ACS 2020–2024 5-year estimates and USPS EDDM route counts.
Works on any site, including WordPress, Wix and Squarespace HTML blocks.
Same card as live HTML. Keep the credit line under it.
How it works and the terms of use: about the ZIP code data badge.
Mail every home in 52659
Route counts on this page price as Full Service 6.5 × 9 postcards: we print, bundle by carrier route and hand the mailing to USPS. Prefer to take it to the Post Office yourself? Print only costs less and you pay postage at drop-off.
How route demographics are estimated
Mailbox counts come from USPS; demographics are estimates
The number of homes and businesses on each carrier route is the current USPS EDDM count. The Census Bureau does not publish figures for carrier routes, so income, homeownership, ages, families, movers and housing age on a route are EDDM2GO estimates built from Census block groups (neighborhood areas of roughly 600 to 3,000 people).
How a route gets its figures: the block-group length-share method
We trace each route's streets every 25 meters and record which block group each stretch falls in. The route's homes are spread along its streets in proportion to length, so a route with 60% of its street length in one block group is assumed to have 60% of its homes there. Each block group then contributes its Census counts in proportion to the share of its housing units that sit on the route (capped at the whole block group). Medians are recalculated from the combined income, home-value and age brackets, the way the Census Bureau computes them, not averaged.
Margins of error
Census survey figures carry a margin of error at 90% confidence; we carry it through the calculation and show it as ±. Our margins treat the route-to-block-group split as exact, so the real uncertainty is larger. Routes with fewer than 100 estimated households, large margins, or streets we could not place are flagged.
Different years
USPS mailbox counts are current. Census figures are 5-year averages for 2020–2024, so a new subdivision may have more homes on the route today than the Census counted. Use the route figures to compare routes with each other, not as an exact head count.
Why some routes show identical figures
Two routes that run through the same block group get the same percentages and medians, because the Census publishes one set of figures for the whole block group. Their mailbox counts still differ, and those are exact.
Route and mailbox counts: USPS EDDM route data. Route demographics: EDDM2GO estimates from U.S. Census Bureau American Community Survey 5-year block-group data (2020–2024) and 2024 cartographic block-group boundaries. This product uses the Census Bureau Data API but is not endorsed or certified by the Census Bureau.
52659 ZIP code: common questions
What city is 52659 in?
52659 is a Winfield, IA mailing address. By land area, 2% lies inside Winfield; the rest is outside any Census-defined city or community.
What county is 52659 in?
52659 is mostly in Henry County (71% of its land), with smaller parts in Louisa County.
What is the population of 52659?
About 1,329 people (±181), according to the Census Bureau's American Community Survey 5-year estimates for 2020–2024. The 2020 Census counted 1,499.
What is the median household income in 52659?
$55,125 (±$12,106), compared with $75,059 for Iowa as a whole. Half the households in the ZIP code earn more and half earn less.
How many carrier routes and mailboxes are in 52659?
2 USPS carrier routes with 546 residential and 5 business mailboxes (551 in all), from the route data stored by EDDM2GO. An EDDM mailing can target any combination of these routes.
What ZIP codes are near 52659?
The closest, measured center to center: 52647 (5.6 mi, Olds), 52644 (6.5 mi, Mount Union), 52652 (6.6 mi, Swedesburg), 52621 (7.3 mi, Crawfordsville), 52640 (8.4 mi, Morning Sun) and 52737 (9.3 mi, Columbus City).